Metric Code Examples
Viewing the Python code for metrics available in the system is accessible from the application interface:
- On the metrics catalog page (Control Panel > Metrics), select the desired metric, hover over the menu symbol (three dots) on the right side of the corresponding row and click "View".
- A screen form with information about the metric will open. Scroll down the page and click the "Open code" button in the bottom right corner of the screen form.
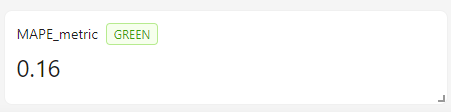
Example of a Scalar Metric with a Traffic Light without a Chart
The flags is_scalar = True and is_signal = True are specified.
The methods scalar and signal are declared and implemented.
The methods __call__ and save are declared, but the implementation is omitted.
from typing import Literal

import pandas as pd
from sklearn.metrics import mean_absolute_percentage_error


class rvc_3_MAPE:
    """
    Mean Absolute Percentage Error (MAPE). Average absolute error in percentage

    Attributes:
        __desc__ (str): Description of the class.
        __tags__ (list[str]): List of tags associated with the class.
        is_scalar (bool): Whether the metric is scalar or not.
        is_signal (bool): Whether the metric has signal or not.

    """

    __desc__ = "Mean Absolute Percentage Error (MAPE). Average absolute error in percentage"
    __tags__ = ["core", "regression", "scalar"]
    is_scalar = True
    is_signal = True

    def __init__(
        self,
        df: pd.DataFrame,
        predict_column: str,
        target_column: str,
        threshold_yellow: float = 0.3,
        threshold_red: float = 0.4,
    ):
        if df.empty:
            raise Exception("Dataframe is empty")
        if target_column not in df:
            raise ValueError(f"Field {target_column} does not exist in the dataframe")
        if predict_column not in df:
            raise ValueError(f"Field {predict_column} does not exist in the dataframe")

        self.predict_column = predict_column
        self.target_column = target_column
        self.df = df.astype({self.predict_column: "float", self.target_column: "float"})
        self.threshold_yellow = threshold_yellow
        self.threshold_red = threshold_red

    def __call__(self) -> None:
        pass

    def scalar(self) -> int | float:
        df = self.df.loc[:, [self.target_column, self.predict_column]].dropna()[
            abs(self.df[self.target_column]) > 0
        ]

        self.scalar_value = mean_absolute_percentage_error(
            y_pred=df[self.predict_column],
            y_true=df[self.target_column],
        )

        return self.scalar_value

    def signal(self) -> Literal["red", "yellow", "green"]:
        signal_light = "green"

        if self.scalar_value > self.threshold_red:
            signal_light = "red"
        elif self.scalar_value > self.threshold_yellow:
            signal_light = "yellow"

        return signal_light

    def save(self, output_dir: str) -> dict[str, str] | None:
        pass
Result:
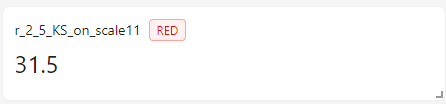
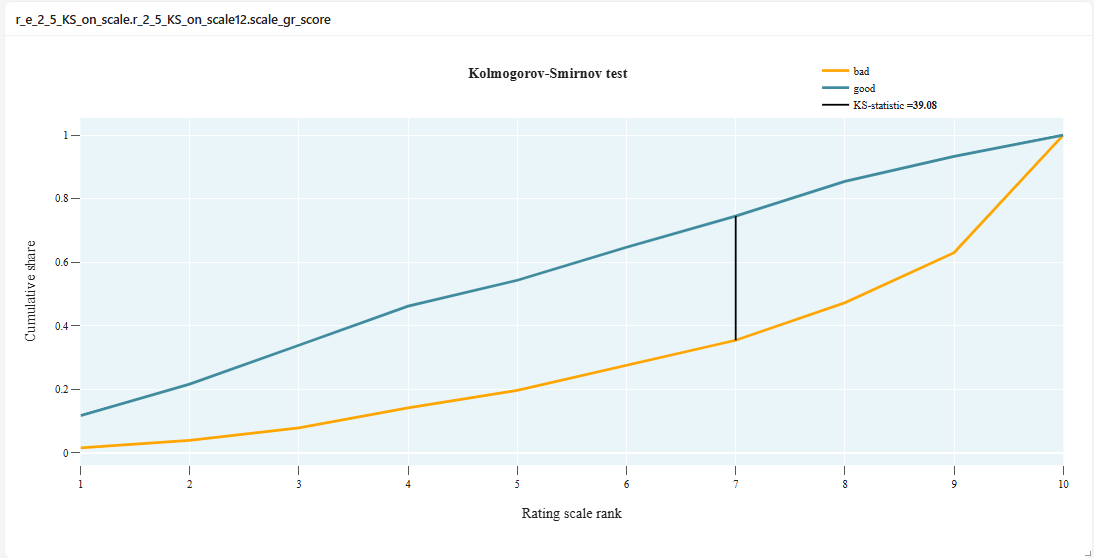
Example of a Scalar Metric with a Traffic Light and a Chart
The flags is_scalar = True and is_signal = True are specified.
The methods scalar and signal are declared and implemented.
The methods __call__ and save are declared and implemented.
from typing import Any, Dict, Literal, Optional

import numpy as np
import pandas as pd
import plotly.graph_objects as go


class r_2_5_KS_on_scale:
    """
    Kolmogorov-Smirnov Test

    Shows how well the model's score separates "good" clients from "bad" ones in terms of the rating scale.

    Attributes:
        __desc__ (str): Description of the class.
        __tags__ (list[str]): List of tags associated with the class.
        is_scalar (bool): Whether the metric is scalar or not.
        is_signal (bool): Whether the metric has signal or not.

    """

    __desc__ = "KS-test on scale. Kolmogorov-Smirnov Test"
    __tags__ = ["risk", "scalar"]

    is_scalar = True
    is_signal = True

    def __init__(
        self,
        df: pd.DataFrame,
        scale_column: str,
        target_column: str,
        threshold_yellow: float = 10,
        threshold_red: float = 30,
    ):
        self.scale_column = scale_column
        self.target_column = target_column
        self.df = df.astype({self.target_column: "float"})
        self.threshold_yellow = threshold_yellow
        self.threshold_red = threshold_red

        if self.df.empty:
            raise Exception("Dataframe is empty")
        if self.target_column not in self.df:
            raise ValueError(f"Field {self.target_column} does not exist in the dataframe")
        if self.scale_column not in self.df:
            raise ValueError(f"Field {self.scale_column} does not exist in the dataframe")
        if self.df[self.scale_column].nunique() > 100:
            raise Exception("Error: the scale variable is not categorical")

    def __call__(self) -> None:
        dataset = self.df.loc[:, [self.target_column, self.scale_column]].dropna()

        # rating scale digit number
        # (the method of obtaining depends on the data format in the self.scale column)
        dataset["bin_number"] = dataset[self.scale_column].map(
            lambda x: int(x.split("_")[-1])
        )  # dataset[self.scale].astype('category').cat.codes#

        dataset = dataset.sort_values(by=["bin_number"], ascending=False)

        good_cnt = dataset[dataset[self.target_column] == 0].shape[0]
        bad_cnt = dataset[dataset[self.target_column] == 1].shape[0]

        gr_bad = (
            pd.DataFrame(
                dataset.groupby("bin_number", observed=False)[self.target_column].sum()
            ).cumsum()
            / bad_cnt
        )
        dataset["target_inverse"] = np.where(dataset[self.target_column] == 1, 0, 1)
        gr_good = (
            pd.DataFrame(
                dataset.groupby("bin_number", observed=False)["target_inverse"].sum()
            ).cumsum()
            / good_cnt
        )

        ks_calc_temp = pd.merge(gr_good, gr_bad, how="left", left_index=True, right_index=True)
        ks_calc_temp["diff"] = 0
        ks_calc_temp["diff"] = abs(
            ks_calc_temp.iloc[:, 0:1].values - ks_calc_temp.iloc[:, 1:2].values
        )

        self.scalar_value = 100 * ks_calc_temp["diff"].max()
        ks_result = round(self.scalar_value, 2)
        result_idx = ks_calc_temp["diff"].argmax()

        x_value1 = gr_bad.index.values.tolist()
        y_value1 = gr_bad[self.target_column].values.astype("float").tolist()
        x_value2 = gr_good.index.values.tolist()
        y_value2 = gr_good["target_inverse"].values.astype("float").tolist()
        x_value3 = [
            float(gr_bad.index.values[result_idx]),
            float(gr_bad.index.values[result_idx]),
        ]
        y_value3 = [
            float(gr_bad[self.target_column].values[result_idx]),
            float(gr_good["target_inverse"].values[result_idx]),
        ]

        line1 = go.Scatter(
            mode="lines",
            x=x_value1,
            y=y_value1,
            name="bad",
            line={"width": 3},
            marker={"color": "#63666A"},
        )
        line2 = go.Scatter(
            mode="lines",
            x=x_value2,
            y=y_value2,
            name="good",
            line={"width": 3},
            marker={"color": "#3eb489"},
        )
        line3 = go.Scatter(
            mode="lines",
            x=x_value3,
            y=y_value3,
            name=f"KS-statistic = {ks_result.astype('float')}",
            marker={"color": "black"},
        )
        self.fig = go.Figure(data=[line1, line2, line3])
        self.fig.layout = self.custom_layout()

    def scalar(self) -> int | float:
        return self.scalar_value

    def signal(self) -> Literal["red", "yellow", "green"]:
        signal_light = "green"

        if self.scalar_value > self.threshold_red:
            signal_light = "red"
        elif self.scalar_value > self.threshold_yellow:
            signal_light = "yellow"

        return signal_light

    def custom_layout(self) -> Optional[Dict[str, Any]]:
        return {
            "title": {"text": "<b>Kolmogorov-Smirnov Test</b>", "x": 0.1, "y": 0.97},
            "legend": {"yanchor": "bottom", "y": 0.05, "xanchor": "right", "x": 1},
            "yaxis": {"title": "Cumulative Share", "side": "left"},
            "xaxis": {
                "title": "Rating Scale Digit",
                "side": "left",
                "type": "category",
                "domain": [0, 0.8],
            },
            "margin": {"t": 35, "b": 5, "l": 5, "r": 5},
        }

    def save(self, output_dir: str) -> dict[str, str] | None:
        self.fig.write_html(
            f"{output_dir}/data.html",
            config={"displaylogo": False},  # remove the plotly logo
        )
        return {f"scale_{self.scale_column}": f"{output_dir}/data.html"}
Result:
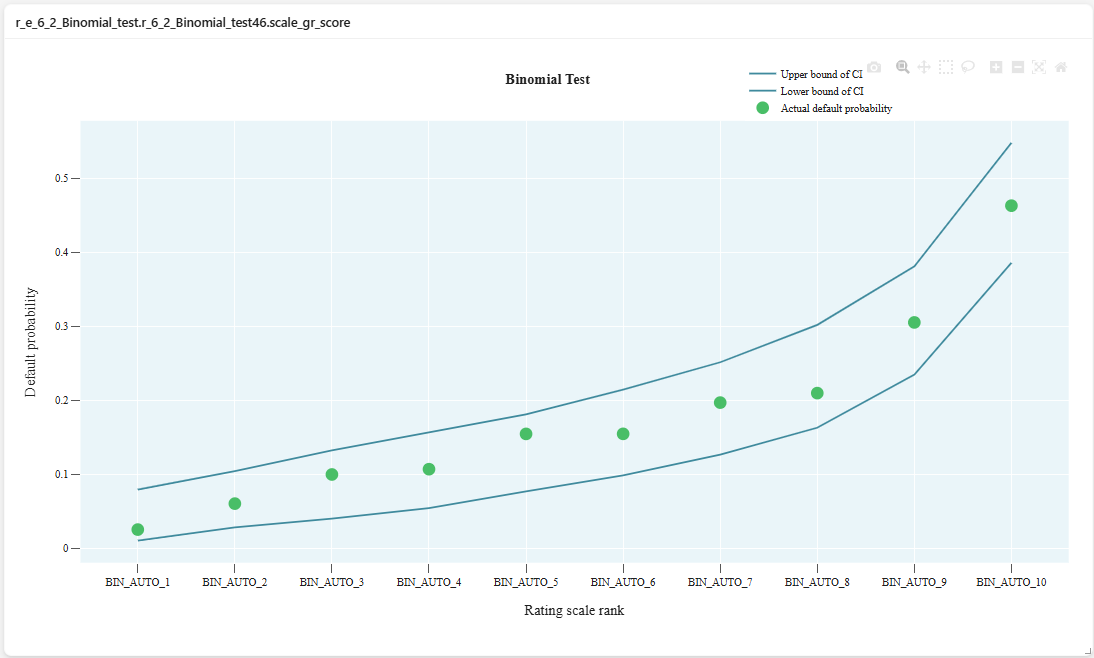
Example of Metric Code with Chart, but without Scalar and Signal
The flags is_scalar = False and is_signal = False are specified.
The methods scalar and signal are not declared.
The methods __call__ and save are declared and implemented.
from typing import Any, Dict, Optional

import numpy as np
import pandas as pd
import plotly.graph_objects as go
from scipy.stats import norm


class r_6_2_Binomial_test:
    """
    Checks the average default level in the rating scale bucket against
    the confidence interval built on the model scores.

    Attributes:
        __desc__ (str): Description of the class.
        __tags__ (list[str]): List of tags associated with the class.
        is_scalar (bool): Whether the metric is scalar or not.
        is_signal (bool): Whether the metric has signal or not.

    """

    __desc__ = "Binomial Test. Биномиальный тест"
    __tags__ = ["risk"]

    is_scalar = False
    is_signal = False

    def __init__(
        self,
        df: pd.DataFrame,
        predict_column: str,
        target_column: str,
        scale_column: str,
        confidence_level: float = 0.99,
    ):
        if predict_column not in df.columns:
            raise ValueError(
                f"Invalid column name for 'predict_column'. "
                f"There is not colomn '{predict_column}' in the dataframe"
            )
        if target_column not in df.columns:
            raise ValueError(
                f"Invalid column name for 'target_column'. "
                f"There is not colomn '{target_column}' in the dataframe"
            )
        if scale_column not in df.columns:
            raise ValueError(
                f"Invalid column name for 'scale_column'. "
                f"There is not colomn '{scale_column}' in the dataframe"
            )

        self.predict_column = predict_column
        self.target_column = target_column
        self.scale_column = scale_column
        self.df = df.astype({self.predict_column: "float", self.target_column: "float"})
        self.confidence_level = confidence_level

        if self.df.empty:
            raise ValueError("Dataframe is empty")
        if self.df[self.scale_column].nunique() > 100:
            raise Exception("Error: scale variable is not categorical")

    def __call__(self) -> None:
        data_gr = (
            self.df[[self.scale_column, self.target_column, self.predict_column]]
            .groupby([self.scale_column], observed=False)
            .agg({self.target_column: ["sum", "count"], self.predict_column: ["mean"]})
            .reset_index()
        )

        data_gr.columns = [self.scale_column, self.target_column, "cnt_all", self.predict_column]
        data_gr["target_prc"] = data_gr[self.target_column] / data_gr["cnt_all"]

        data_gr["CI_LEFT"] = data_gr[self.predict_column] - norm.ppf(
            self.confidence_level
        ) * np.sqrt(
            (data_gr[self.predict_column] * (1 - data_gr[self.predict_column])) / data_gr["cnt_all"]
        )
        data_gr["CI_RIGHT"] = data_gr[self.predict_column] + norm.ppf(
            self.confidence_level
        ) * np.sqrt(
            (data_gr[self.predict_column] * (1 - data_gr[self.predict_column])) / data_gr["cnt_all"]
        )

        data_gr["color"] = data_gr.apply(
            lambda x: "green"
            if (x["target_prc"] >= x["CI_LEFT"]) & (x["target_prc"] <= x["CI_RIGHT"])
            else "red",
            axis=1,
        )

        data_gr = data_gr.sort_values(self.scale_column, key=lambda x: x.str[-3:])
        # sorting above is specific to the particular df,
        # pay attention to the format of entries in the scale column
        # when running on new data

        line1 = go.Scatter(
            mode="lines",
            x=data_gr[self.scale_column].tolist(),
            y=data_gr["CI_RIGHT"].tolist(),
            name="Upper CI Bound",
            marker={"color": "#23654D"},
            xaxis="x1",
            yaxis="y1",
        )
        line2 = go.Scatter(
            mode="lines",
            x=data_gr[self.scale_column].tolist(),
            y=data_gr["CI_LEFT"].tolist(),
            name="Lower CI Bound",
            marker={"color": "#23654D"},
            xaxis="x1",
            yaxis="y1",
        )
        line3 = go.Scatter(
            mode="markers",
            x=data_gr[self.scale_column].tolist(),
            y=data_gr["target_prc"].tolist(),
            name="Actual Default Probability",
            marker={"color": data_gr["color"].tolist(), "size": 24},
            xaxis="x1",
            yaxis="y1",
        )

        self.fig = go.Figure(data=[line1, line2, line3])
        self.fig.layout = self.custom_layout()

    def custom_layout(self) -> Optional[Dict[str, Any]]:
        return {
            "title": {"text": "<b>Binomial Test</b>", "x": 0.1, "y": 0.97},
            "legend": {"yanchor": "bottom", "y": 0.01, "xanchor": "left", "x": 1},
            "yaxis": {"title": "Default Probability", "side": "left"},
            "xaxis": {
                "title": "Rating Scale Tier",
                "side": "right",
                "type": "category",
                "domain": [0, 1],
            },
            "margin": {"t": 35, "b": 5, "l": 5, "r": 5},
        }

    def save(self, output_dir: str) -> dict[str, str] | None:
        self.fig.write_html(
            f"{output_dir}/data.html",
            config={"displaylogo": False},  # remove the plotly logo
        )
        return {f"scale_{self.scale_column}": f"{output_dir}/data.html"}
Result:
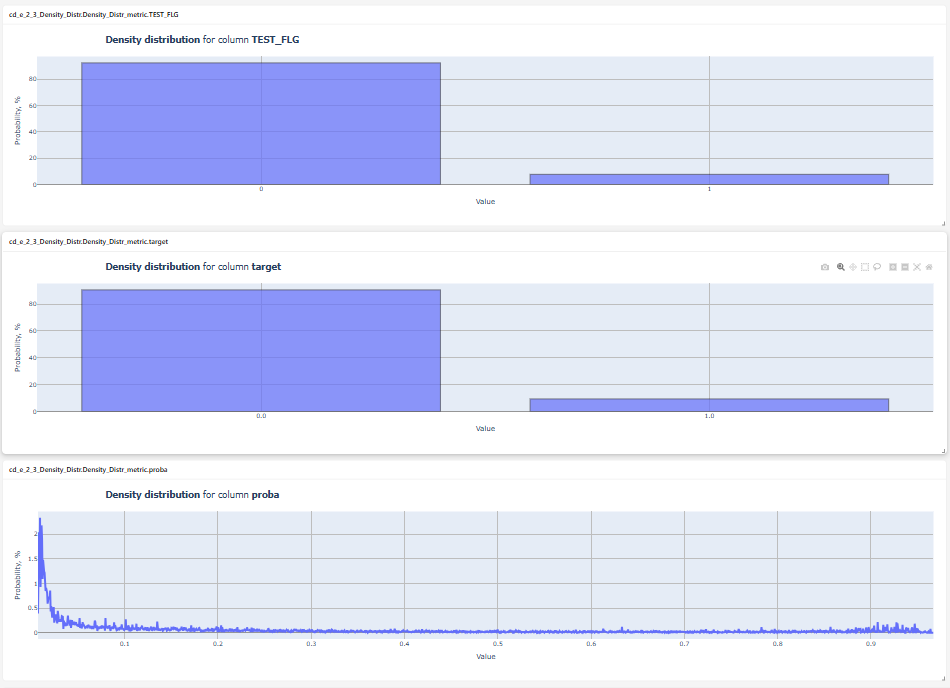
Example of Metric Code with Multiple Charts
The methods __call__ and save are declared and implemented.
In the save method, charts are created in a loop.
from typing import Any, Dict, Optional

import pandas as pd
import plotly.graph_objects as go


class cd_2_4_Density_Distr_features:
    """
    Density Distribution for Selected Columns
    Attributes:
        __desc__ (str): Description of the class.
        __tags__ (list[str]): List of tags associated with the class.
        is_scalar (bool): Whether the metric is scalar or not.
        is_signal (bool): Whether the metric has signal or not.

    """

    __desc__ = (
        "Density Distribution for Selected Columns. Density distribution for selected fields"
    )
    __tags__ = ["core", "data"]

    is_scalar = False
    is_signal = False

    def __init__(
        self,
        df: pd.DataFrame,
        field_columns: str,
        categorial_threshold: int = 10,
        split_charts: bool = False,
    ):
        self.df = df
        self.categorial_threshold = categorial_threshold
        self.split_charts = split_charts
        self.field_columns = [x.strip() for x in field_columns.split(",")]
        if self.df.empty:
            raise Exception("Dataframe is empty")
        for field in self.field_columns:
            if field not in self.df:
                raise ValueError(f"Field {field} does not exist in the dataframe")

    def __call__(self) -> None:
        self.df = self.df[self.field_columns]
        charts_dict = self.create_fields_charts()

        if self.split_charts:
            self.figs = {
                column_name: go.Figure(
                    data=[chart], layout=self.custom_layout(column_name=column_name)
                )
                for column_name, chart in charts_dict.items()
            }
        else:
            self.fig = go.Figure(data=list(charts_dict.values()), layout=self.custom_layout())

    def create_fields_charts(self):
        signal = {}
        self.min_x = 0
        self.max_x = 0
        counted_labels = []

        # loop through all columns in df
        for columnName, columnData in self.df.items():
            # if the data in the column is not numeric, skip it
            if not pd.api.types.is_numeric_dtype(columnData):
                print(f'Column "{columnName}" type is not numeric')
                continue

            counted_labels.append(columnName)
            visible_mode = (
                "legendonly" if columnName != counted_labels[0] and not self.split_charts else True
            )

            # if the data in the column is categorical, build a histogram
            if columnData.nunique() <= self.categorial_threshold:
                freq_df = (
                    columnData.value_counts(normalize=True, sort=False, dropna=True)
                    .reset_index()
                    .sort_values(columnName)
                )

                freq_df["percent"] = freq_df["proportion"] * 100
                if self.split_charts:
                    freq_df[columnName] = freq_df[columnName].astype("string")

                elem = go.Bar(
                    x=freq_df[columnName].tolist(),
                    y=freq_df["percent"].tolist(),
                    name=columnName,
                    opacity=0.7,
                    marker=dict(line=dict(color="black", width=1.0)),
                    visible=visible_mode,
                )
                signal[columnName] = elem
                continue

            # otherwise - linear density distribution graph
            vals = columnData.dropna().values
            nbucket = int(len(vals) / 10) + 1
            den_x = []
            den_y = []
            wgth = (max(vals) - min(vals)) / nbucket  # width of one interval
            minval = min(vals)
            self.max_x = max(max(vals), self.max_x)
            self.min_x = min(min(vals), self.min_x)
            self.max_pos = 0

            for i in range(0, nbucket):
                count = 0
                for j in vals:
                    if (minval + i * wgth) <= j < (minval + (i * wgth) + wgth):
                        count = count + 1
                den_x.append(round((minval + i * wgth + wgth / 2), 6))
                den_y.append(round(count * 100 / (len(vals)), 6))

            elem = go.Scatter(
                x=den_x,
                y=den_y,
                name=columnName,
                mode="lines",
                line_width=4,
                line_dash="solid",
                visible=visible_mode,
            )

            self.max_pos = max(max(den_y), self.max_pos)

            signal[columnName] = elem

        return signal

    def custom_layout(self, column_name: str | None = None) -> Optional[Dict[str, Any]]:
        column_info = (
            " of selected columns" if column_name is None else f" for column <b>{column_name}</b>"
        )
        return {
            "title": {"text": f"<b>Density Distribution</b>{column_info}", "x": 0.1, "y": 0.98},
            "legend": {"yanchor": "bottom", "y": 0.05, "xanchor": "right", "x": 1},
            "xaxis": {
                "title": "Value",
                "side": "left",
                "showgrid": True,
                "zeroline": True,
                "gridcolor": "#bdbdbd",
                "gridwidth": 1.5,
                "zerolinecolor": "#969696",
                "zerolinewidth": 3,
            },
            "yaxis": {
                "title": "Probability, %",
                "side": "left",
                "showgrid": True,
                "zeroline": True,
                "gridcolor": "#bdbdbd",
                "gridwidth": 1.5,
                "zerolinecolor": "#969696",
                "zerolinewidth": 3,
            },
            "margin": {"t": 45, "b": 5, "l": 5, "r": 5},
        }

    def save(self, output_dir: str) -> dict[str, str] | None:
        if self.split_charts:
            result = {}
            for column_name, fig in self.figs.items():
                file_path = f"{output_dir}/data_{column_name}.html"
                fig.write_html(
                    file_path,
                    config={"displaylogo": False},  # remove the plotly logo
                )

                result[column_name] = file_path
            return result
        else:
            self.fig.write_html(
                f"{output_dir}/data.html",
                config={"displaylogo": False},  # remove the plotly logo
            )

            return {"fig_name": f"{output_dir}/data.html"}
Result:
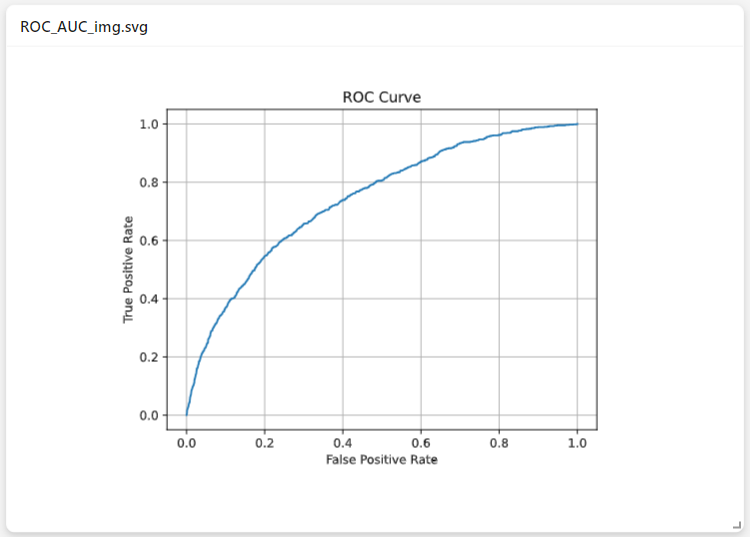
Example of Metric Code that Saves the Result as an Image
The methods __call__ and save are declared and implemented.
In the save method, the graphs are saved as images, not HTML files.
from typing import Any, Dict, Literal, Optional

import numpy as np
import pandas as pd
from sklearn.metrics import roc_auc_score, roc_curve
import matplotlib.pyplot as plt


class ROC_AUC_img:
    """
    ROC-AUC Value and ROC Curve Plot

    Attributes:
        __desc__ (str): Description of the class.
        __tags__ (list[str]): List of tags associated with the class.
        is_scalar (bool): Whether the metric is scalar or not.
        is_signal (bool): Whether the metric has signal or not.

    """

    __desc__ = "ROC Curve Plot, ROC-AUC Value"
    __tags__ = ["core", "classification", "scalar"]

    is_scalar = True
    is_signal = True

    def __init__(
        self,
        df: pd.DataFrame,
        predict_column: str,
        target_column: str,
        threshold_yellow: float = 0.75,
        threshold_red: float = 0.65,
    ):
        self.predict_column = predict_column
        self.target_column = target_column
        self.df = df.astype({self.predict_column: "float", self.target_column: "float"})
        self.threshold_yellow = threshold_yellow
        self.threshold_red = threshold_red

        if self.df.empty:
            raise Exception("Dataframe is empty")
        if self.target_column not in self.df:
            raise ValueError(f"Field {self.target_column} does not exist in the dataframe")
        if self.predict_column not in self.df:
            raise ValueError(f"Field {self.predict_column} does not exist in the dataframe")
        if self.predict_column == self.target_column:
            raise Exception("Error. Check the selection of columns for calculation")

    def __call__(self) -> None:
        temp = self.df.loc[:, [self.target_column, self.predict_column]].dropna()
        preds = temp[self.predict_column]
        y_test = temp[self.target_column]

        fpr, tpr, threshold = roc_curve(y_test, preds)
        fpr = np.around(fpr, decimals=4).tolist()
        tpr = np.around(tpr, decimals=4).tolist()
        base_roc = np.around(np.linspace(0, 1, 10), decimals=2).tolist()

        self.scalar_value = float(
            roc_auc_score(temp[self.target_column], temp[self.predict_column])
        )
        self.fig, ax = plt.subplots()
        ax.plot(fpr, tpr)
        ax.set(xlabel='False Positive Rate', ylabel='True Positive Rate', title='ROC Curve')
        ax.grid()

    def scalar(self) -> int | float:
        return self.scalar_value

    def signal(self) -> Literal["red", "yellow", "green"]:
        signal_light = "green"

        if self.scalar_value < self.threshold_red:
            signal_light = "red"
        elif self.scalar_value < self.threshold_yellow:
            signal_light = "yellow"

        return signal_light

    def save(self, output_dir: str) -> dict[str, str] | None:
        self.fig.savefig(f"{output_dir}/data.svg")
        return {"svg": f"{output_dir}/data.svg"}
Result: