How to Create a Monitoring Project
A monitoring project in the Predicate application represents a graph consisting of nodes (data, transformations, metrics) and connections between them for data analysis and model monitoring. The result of the project is an automatically generated dashboard with metric visualizations.
Typical Use Case
-
Data Preparation - Select an existing dataset from the Dataset Catalog - Or register a New Dataset by uploading a CSV file, selecting a file from S3 storage, or connecting to a SQL table - Ensure that a suitable Data Source is selected for your task
-
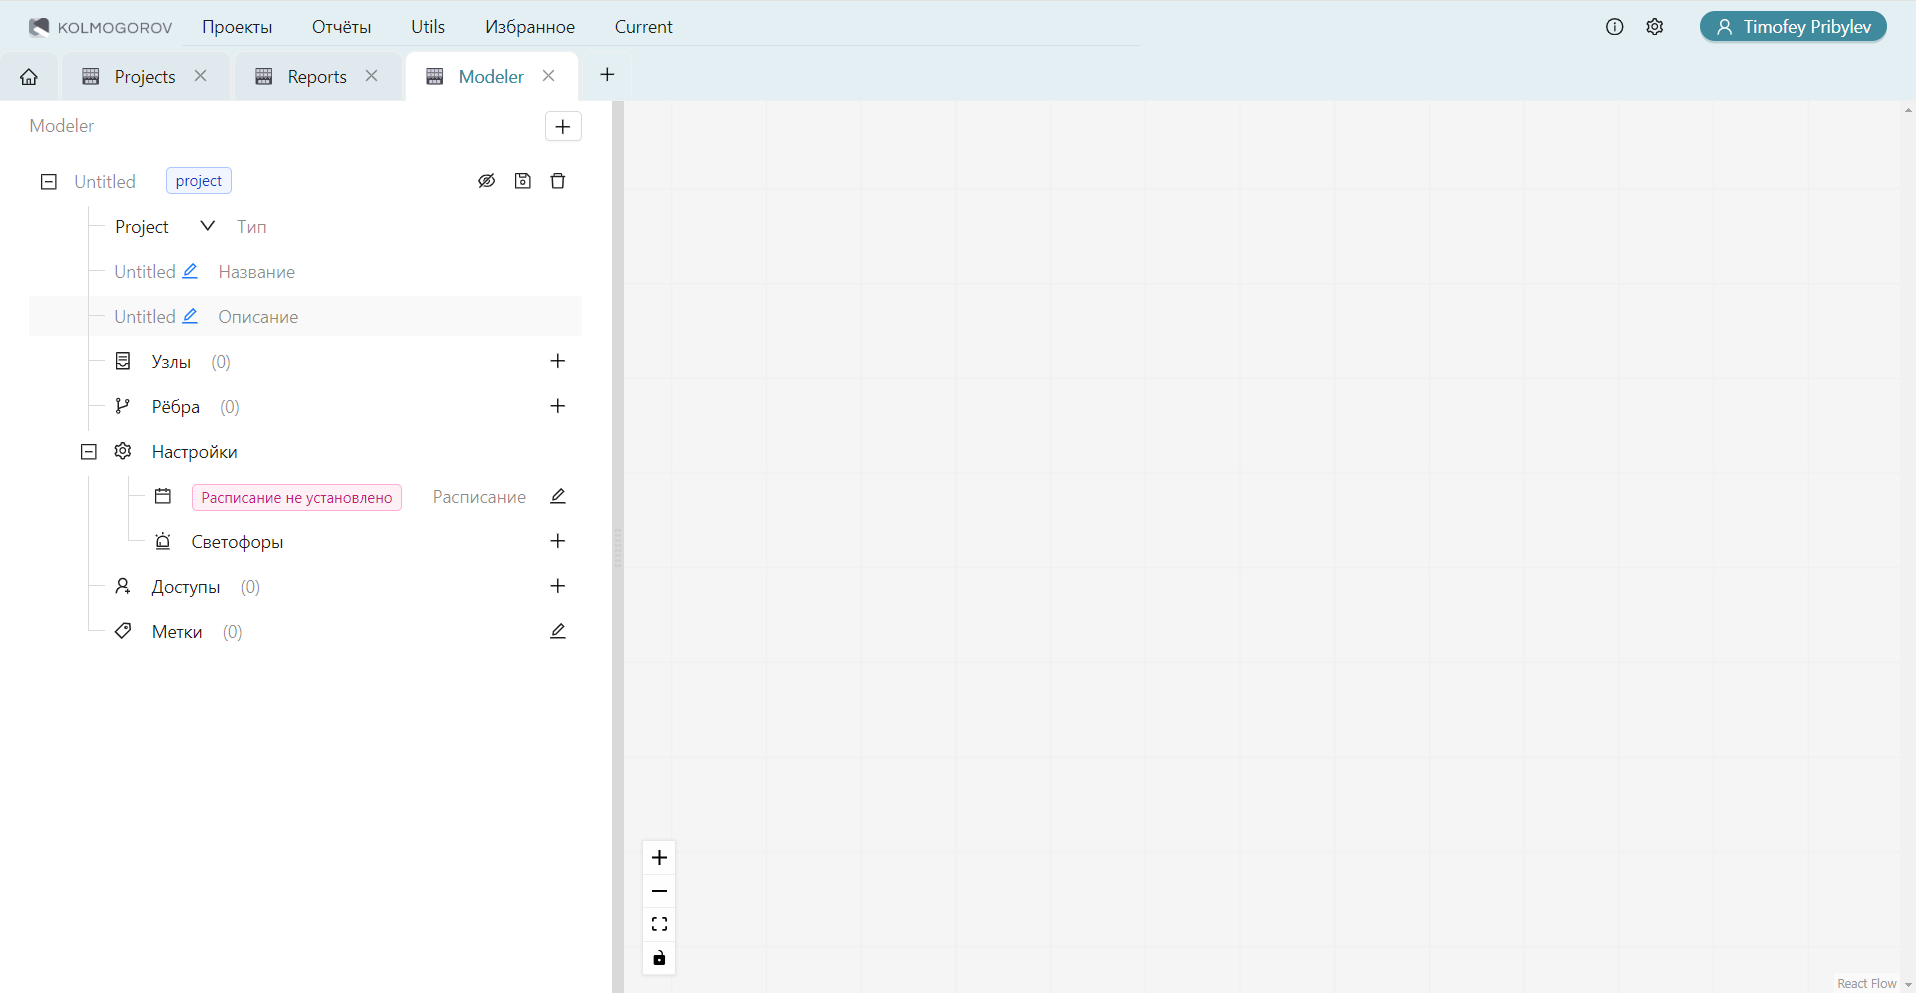
Creating and Configuring the Project - Go to Creating a New Project through the main menu - Alternatively, create a project from an existing Template if a suitable template exists - Build the project graph by adding nodes of three types:
- Data nodes - by selecting datasets from the catalog
- Transformation nodes - for data preparation and transformation
- Metric nodes - for analysis and evaluation of indicators
-
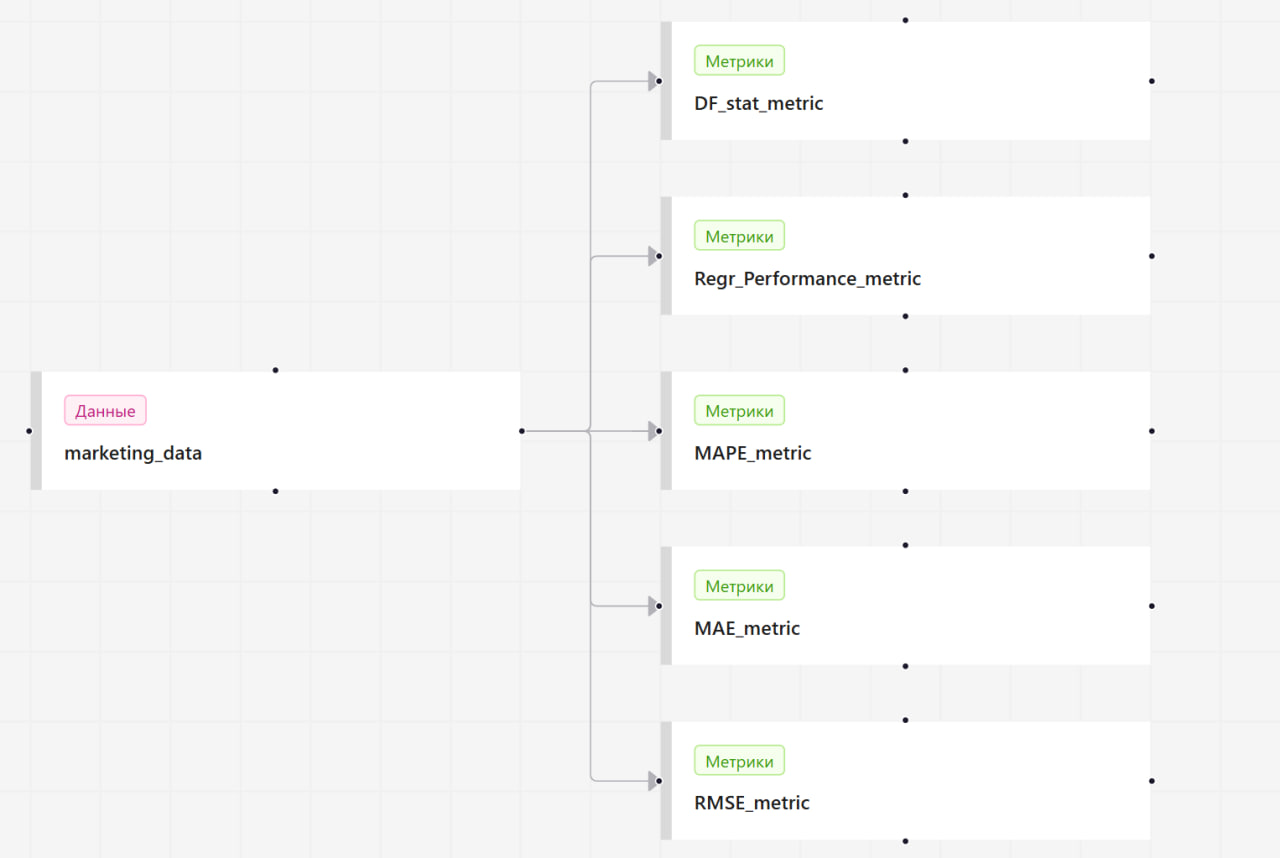
Building Connections in the Project - Create connections between nodes according to the logic of data processing - Follow the connection rules: data → transformations → metrics - Use the project diagram for visual graph building
-
Setting Up Execution Schedule - Configure the Project Schedule for regular monitoring - Choose the frequency (daily, weekly, monthly) - Define the data retrieval mode and analysis depth (number of periods) - If a one-time run is needed, skip this step
-
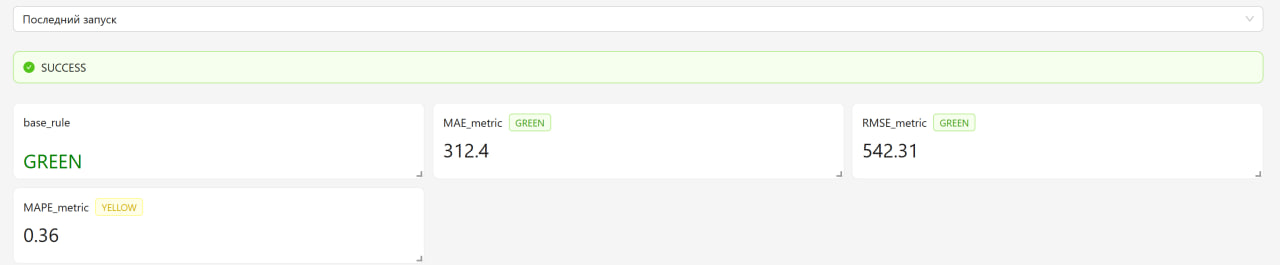
Setting Up Traffic Lights for Monitoring - Create rules for the Project Traffic Lights - Define conditions for statuses GREEN (good), YELLOW (satisfactory), RED (bad) - Use scalar metric values in traffic light rules
-
Running and Analyzing Results - After saving, the project runs automatically or according to the established schedule - Check the project status in the Project Catalog - View Monitoring Results after calculations are completed - If necessary, create a Custom Report based on the obtained data
-
Comparing Results of Different Projects - Use the Project Comparison functionality - Select up to three projects and specific runs for comparison - Analyze metrics in parallel columns to identify differences and trends
-
Optimizing and Updating the Project - Based on the analysis of results, make adjustments to the project settings - Add new metrics or transformations as needed - Configure project access for other system users
This approach ensures a complete cycle of working with data: from preparation to result analysis and optimization of monitoring processes. The graph structure of the project allows for flexible data flow configuration and reuse of components in various projects.