Creating a New Project
Procedure for creating a project for one-time or multiple monitoring of model performance.
Transition to the Project Creation Form
The transition to the form for creating a new project is done from the main menu of the application in one of the following ways.
- Method 1: Control Panel > Create > Project
-
Method 2: Control Panel > Projects > Add
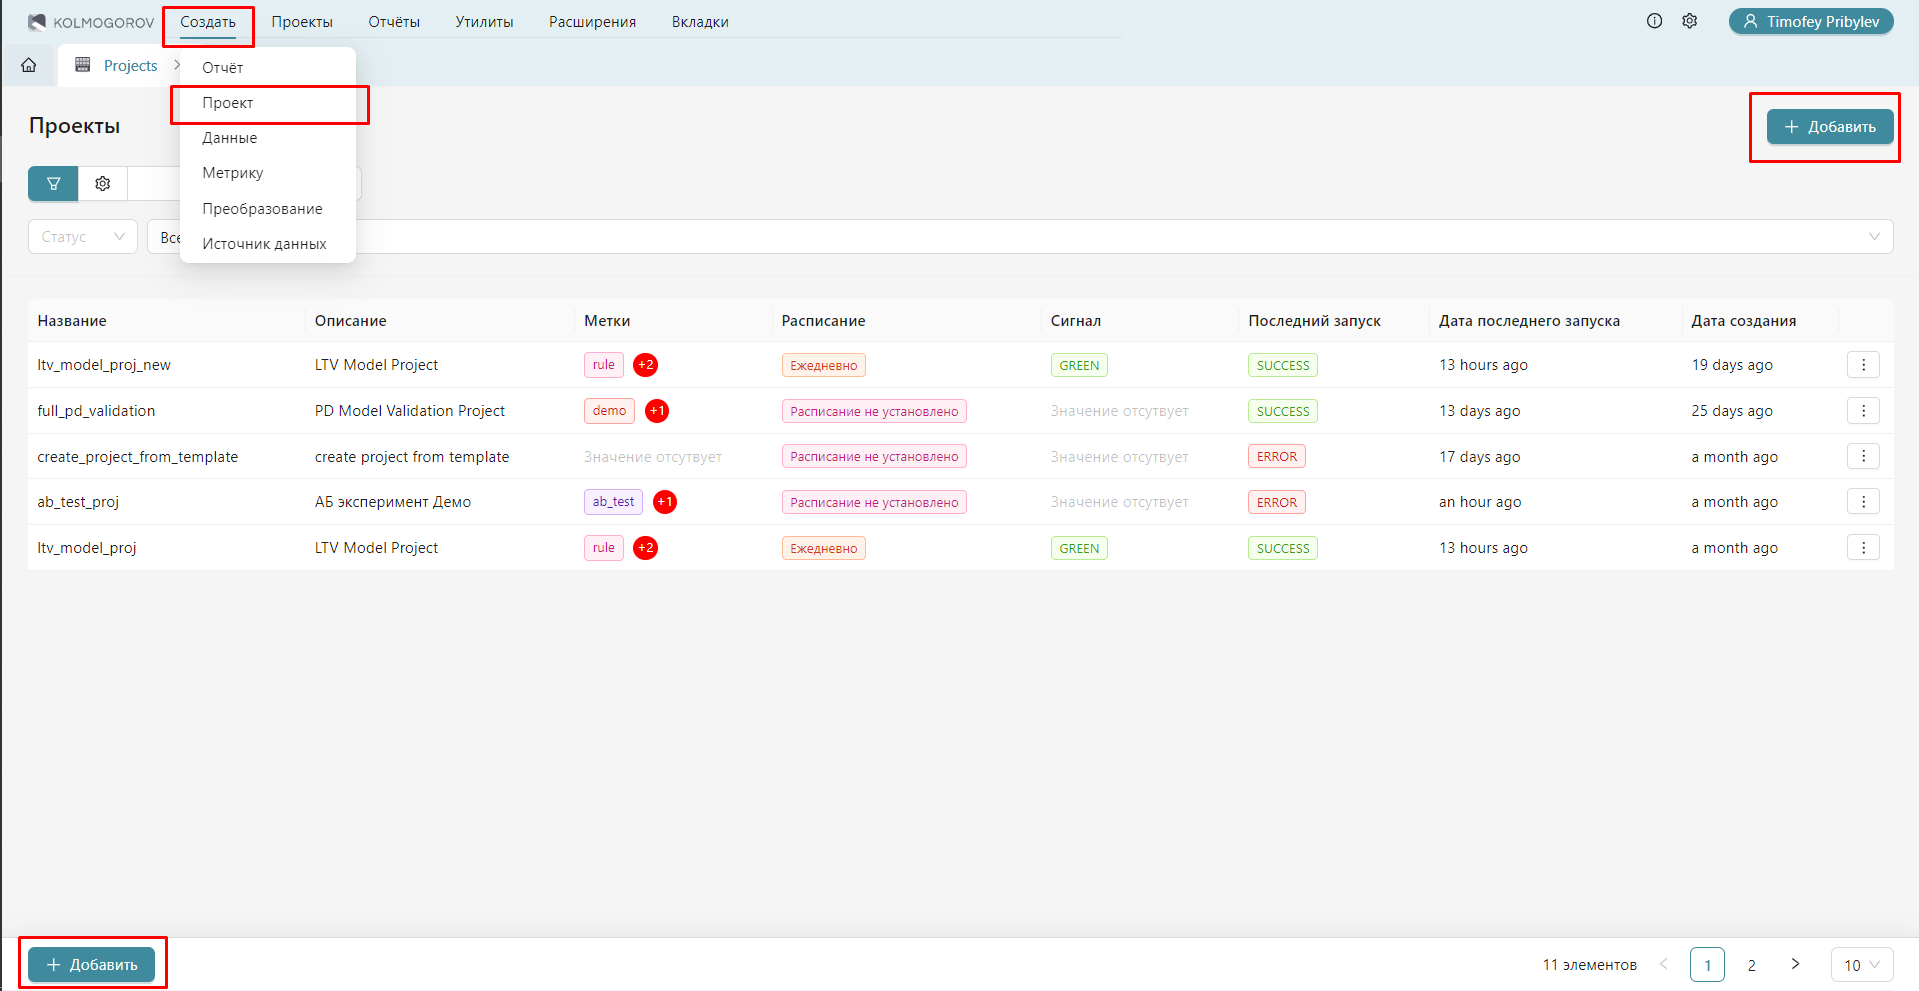
-
The algorithm for Creating a Project from a Template is described on a separate page.
As a result, the editor for creating a new project will open:
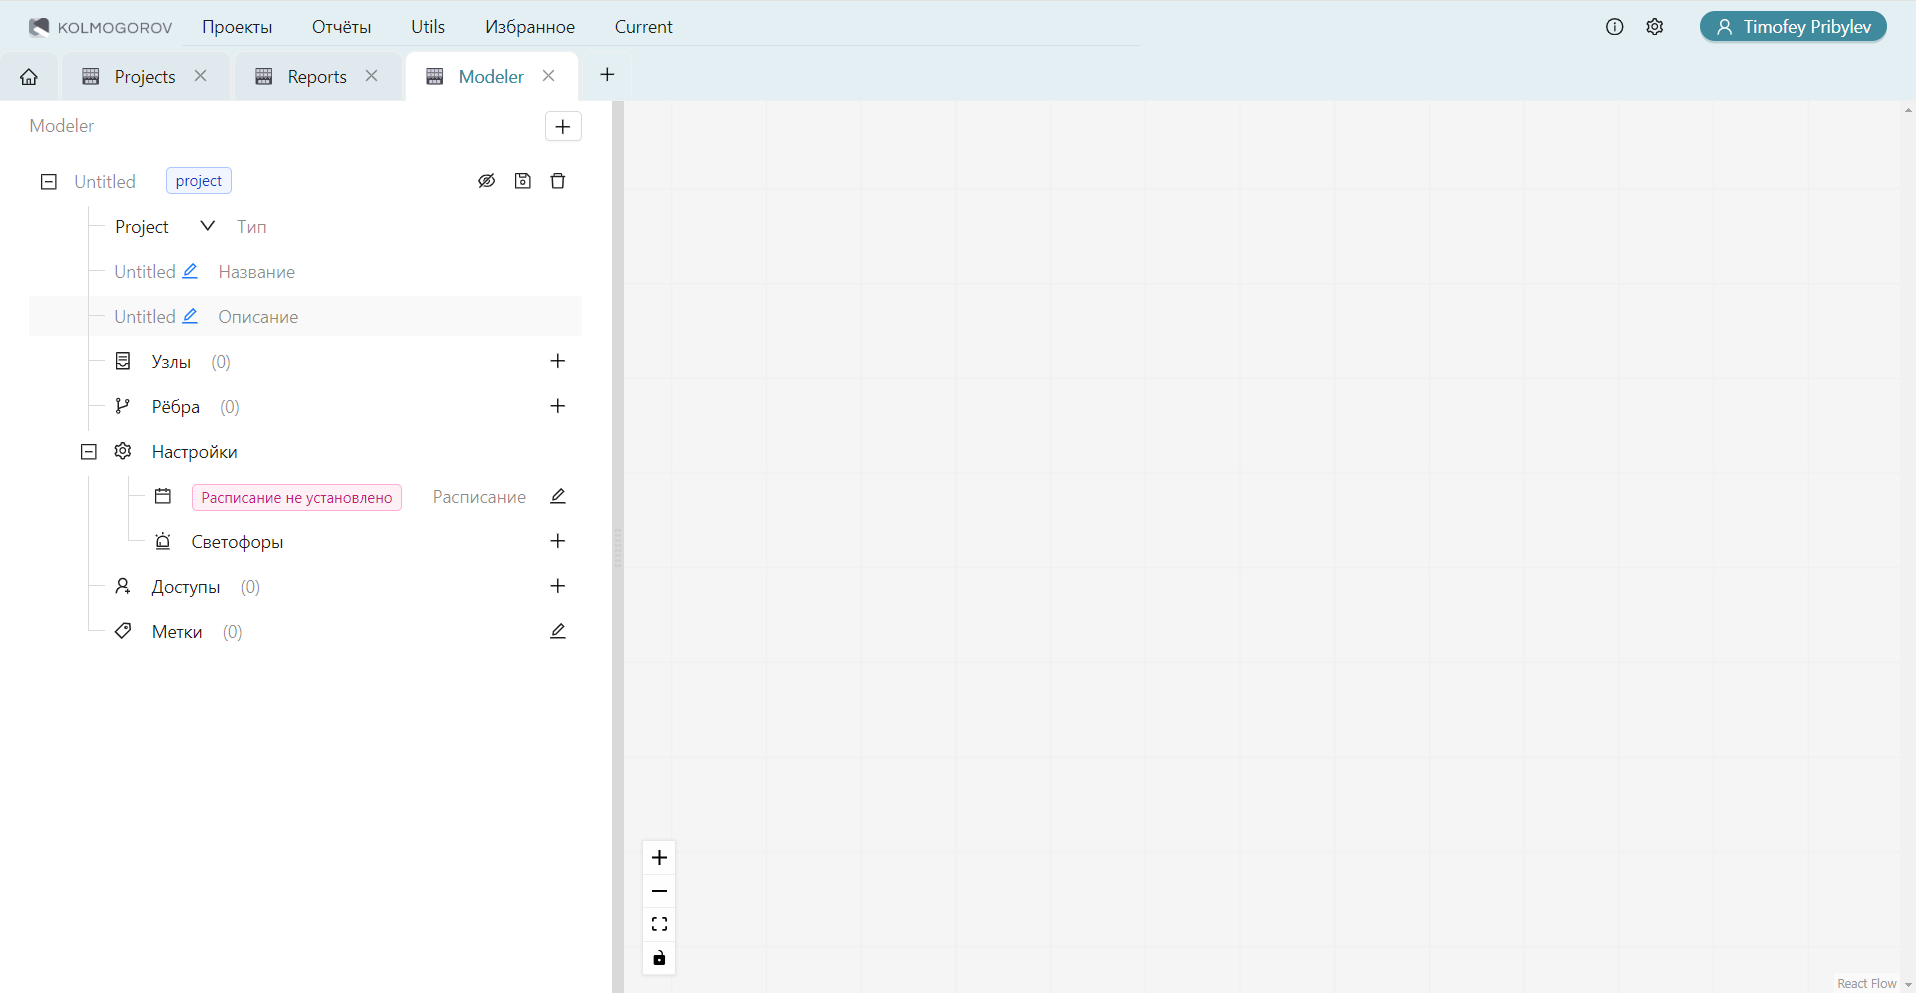
Overview of the Project Editor
The project editor has 8 main sections:
- Selection of object type (project or project template). In this case, the type "Project" is automatically selected.
- Filling/editing basic information (unique title and description).
- Adding/deleting/editing nodes (data, transformations, or metrics).
- Adding/deleting/editing edges (connections between nodes).
- Scheduling configuration.
- Adding/deleting/editing project traffic lights.
- Adding/deleting/editing access rights.
- Adding/deleting/editing tags.
Additionally, buttons for viewing the diagram showing nodes and edges between them, saving the project, and deleting unsaved project data are available.
There is also a button in the editor for adding a new object. With it, you can create multiple projects simultaneously.
The project title and description are text fields entered by the user. The project title must be unique and contain only Latin letters, numbers, hyphens, and underscores.
After filling in all project parameters, you must click the save button and confirm the creation of the project in the pop-up window that appears.
More details on other settings are below.
Configuring Project Nodes
After adding a node using the “+” button, a form for configuring the node appears:

The form has the following fields:
- Node type: a dropdown list with options "Metric," "Transformation," or "Dataset."
- Node alias: a technical name for the node, which will be used to reference its content within the project. For example, the alias of a node with a dataset will be used to reference the data in the metric parameters. The alias must contain only Latin letters and numbers and must not be repeated within the project.
- Settings: a set of additional fields that depend on the node type, with a “+” button intended for adding a specific object of the corresponding type to the node.
Below are descriptions of settings by object types.
Dataset Node
When selecting the node type "Dataset," the “+” button for settings will open a modal window with a catalog of datasets:

After selecting a dataset from the catalog, fields with parameters describing the selected dataset will appear in the "Settings" section. These fields are informational, and no further configuration of the node is required:

Transformation Node
When selecting the node type "Transformation," the “+” button for settings will open a modal window with a catalog of transformations:

After selecting a transformation from the catalog, fields with parameters describing the selected transformation will appear in the "Settings" section:

Some of the parameters are editable and are input data for the transformation, so you need to click the edit button and enter the necessary data in the opened window:

Metric Node
When selecting the node type "Metric," the “+” button for settings will open a modal window with a catalog of metrics:

After selecting a metric from the catalog, fields with parameters describing the selected metric will appear in the "Settings" section:

Some of the parameters are editable and are input data for the metric, so you need to click the edit button and enter the necessary data in the opened window:

Configuring Project Edges
Edges connect nodes to each other to define the sequence of node execution.
To configure edges, you need to click the button to display the project diagram, and then connect the nodes in the required sequence by dragging an arrow from one node to another. Edges will be automatically defined in the corresponding field:

It is important to consider the restrictions on working with edges for different types of nodes:
- Dataset: incoming edges to the node cannot be created; outgoing edges can lead to a transformation or metric node.
- Transformation: incoming edges can come from a dataset node or another transformation; outgoing edges can lead to a transformation or metric node.
- Metric: incoming edges can come from a dataset or transformation node; outgoing edges cannot be created.
There are no restrictions on the number of incoming and outgoing edges for any node.
There is no additional parameterization for edges.
Configuring the Schedule
One-Time Launch
Important
If a one-time launch of the project is planned, do not configure the schedule.
The calculation will begin immediately after the project is created.
Regular Launches
After selecting the scheduling settings, a modal window for scheduling configuration will open:

Period (mandatory) - the frequency of project launches:
- Daily;
- Weekly;
- Monthly.
Mode (mandatory) - the mode of data retrieval from the source:
- From the launch date - the period is counted from the launch date;
- Nearest completed full period - the nearest completed full period (week from Mon to Sun / month from the 1st to the 31st / ...).
Start Date (mandatory) - the start date of regular monitoring. From this date, periods for data retrieval are counted "backward."
Number of Periods (mandatory) - the number of periods for data retrieval (width of the sliding window); data for this number of periods will be considered in the calculations.
Example
Suppose the start date of the project is chosen as October 20, 2022 (Thursday),
the period is weekly, and the number of periods is 2.
Then, in the case of selecting the mode From the launch date
calculations will be conducted on data from October 6-20, 2022 (2 weeks from Thu to Thu), and when selecting the mode
Nearest completed full period - on data from October 3-17, 2022 (2 weeks from Mon to Mon).
Important
The configuration of the sliding window for data retrieval during scheduled launches of the project
is only available for datasets with the marked Column containing the observation date
when creating the dataset.
For datasets without such a column,
a scheduled launch of the project is also possible. In this case, at each launch,
all records currently available in the data object will be taken for calculations.
Configuring Traffic Lights
The project traffic light is an indicator of the quality of metrics for the entire project as a whole. The traffic light can be green, yellow, or red. It can also be a main or additional traffic light. The main traffic light is displayed in the project catalog.
When clicking the button to add a traffic light, a modal window for configuring the traffic light appears:
 The parameters of the traffic light are as follows:
- Name (mandatory)
- Type (mandatory):
- Main traffic light - displayed in the catalog as the traffic light for the project, there can be no more than one;
- Additional traffic light - displayed only in the project, there can be as many as needed.
- Rule for calculating the traffic light (mandatory).
The traffic light rule can be automatically filled in using the "Set Default Rule" button. In this case, a rule will be created that uses all project metrics that return a scalar value. The logic of the rule will be based on the traffic lights of the metrics – if all metric traffic lights are green, the project traffic light is green. If there is at least one red metric traffic light, the project traffic light is red. In other cases, the project traffic light is yellow.
An alternative method for creating a rule is to manually write the rule, after which you need to click the "Validate" button to check the correctness of the written rule. When writing the rule, the following syntax must be followed:
- The rule is a logical expression of the format
If condition then action [elif condition then action] else action. Theelifblock can be repeated zero or more times. - The action is either a block that assigns a color to the traffic light when the condition is met.
It has the form
result = <GREEN|YELLOW|RED>. Or a nested if-expression of the same structure. - The condition is a logical expression containing comparisons
of scalar values of metrics or their traffic lights with any values:
- To reference the scalar value of a metric, you must use the method
scalar(<alias of the node with the metric>). Available logical operators:>,<,>=,<=,==,!=. The comparison is made either with the scalar value of another metric, or with a real number. - To reference the traffic light of a metric, you must use the method
signal(<alias of the node with the metric>). Available logical operators:==,!=. The comparison is made either with the traffic light of another metric, or with the constantsRED,YELLOW,GREEN. - The logical expression can also use
parentheses and the operators
ORandAND.
- To reference the scalar value of a metric, you must use the method
After filling in all the parameters of the traffic light, you must click the "Add" button.
Configuring Access Rights
Access rights configuration allows you to define the list of users who can access the created project. When clicking the access rights configuration button, the corresponding modal window opens:

The form has the following fields and buttons:
- Add – adds another line to fill in the user-access level pair.
- Username – a dropdown list of system user names.
- Access – the access level granted to the user:
- Owner – full access with the ability to edit the project;
- Read-only – access only to view the results of the project execution.
After filling in all access parameters, you must click the "Save" button.
Configuring Tags
Tags are project labels. When clicking the tag configuration button, a window with a dropdown list of available tags will appear, where you can either select existing tags or write your own tag. The number of tags on one project is unlimited.
Viewing the Created Project
After the project is created, a corresponding row for this project appears in the Project Catalog (Control Panel > Projects) and the status of this project is displayed.
Instructions for viewing the report with the results of the project are presented in the section "Monitoring Results".